
browser-use agent with the Laminar Debugger so you can rerun from checkpoints.
1) Install prerequisites
Installuv if you do not already have it:
2) Set environment variables
Create a.env file in your project root:
3) Create the entrypoint
- The
rollout_entrypoint=Trueflag marks this function for debugger sessions. - Keep the CLI running while you iterate; the debugger will rerun using the latest code on disk.
4) Start a debugger session
--function main.
[Screenshot: terminal output with debugger session link]
5) Open the debugger in Laminar
Open Debugger in your project, select the session, provide input arguments as JSON, and click Run.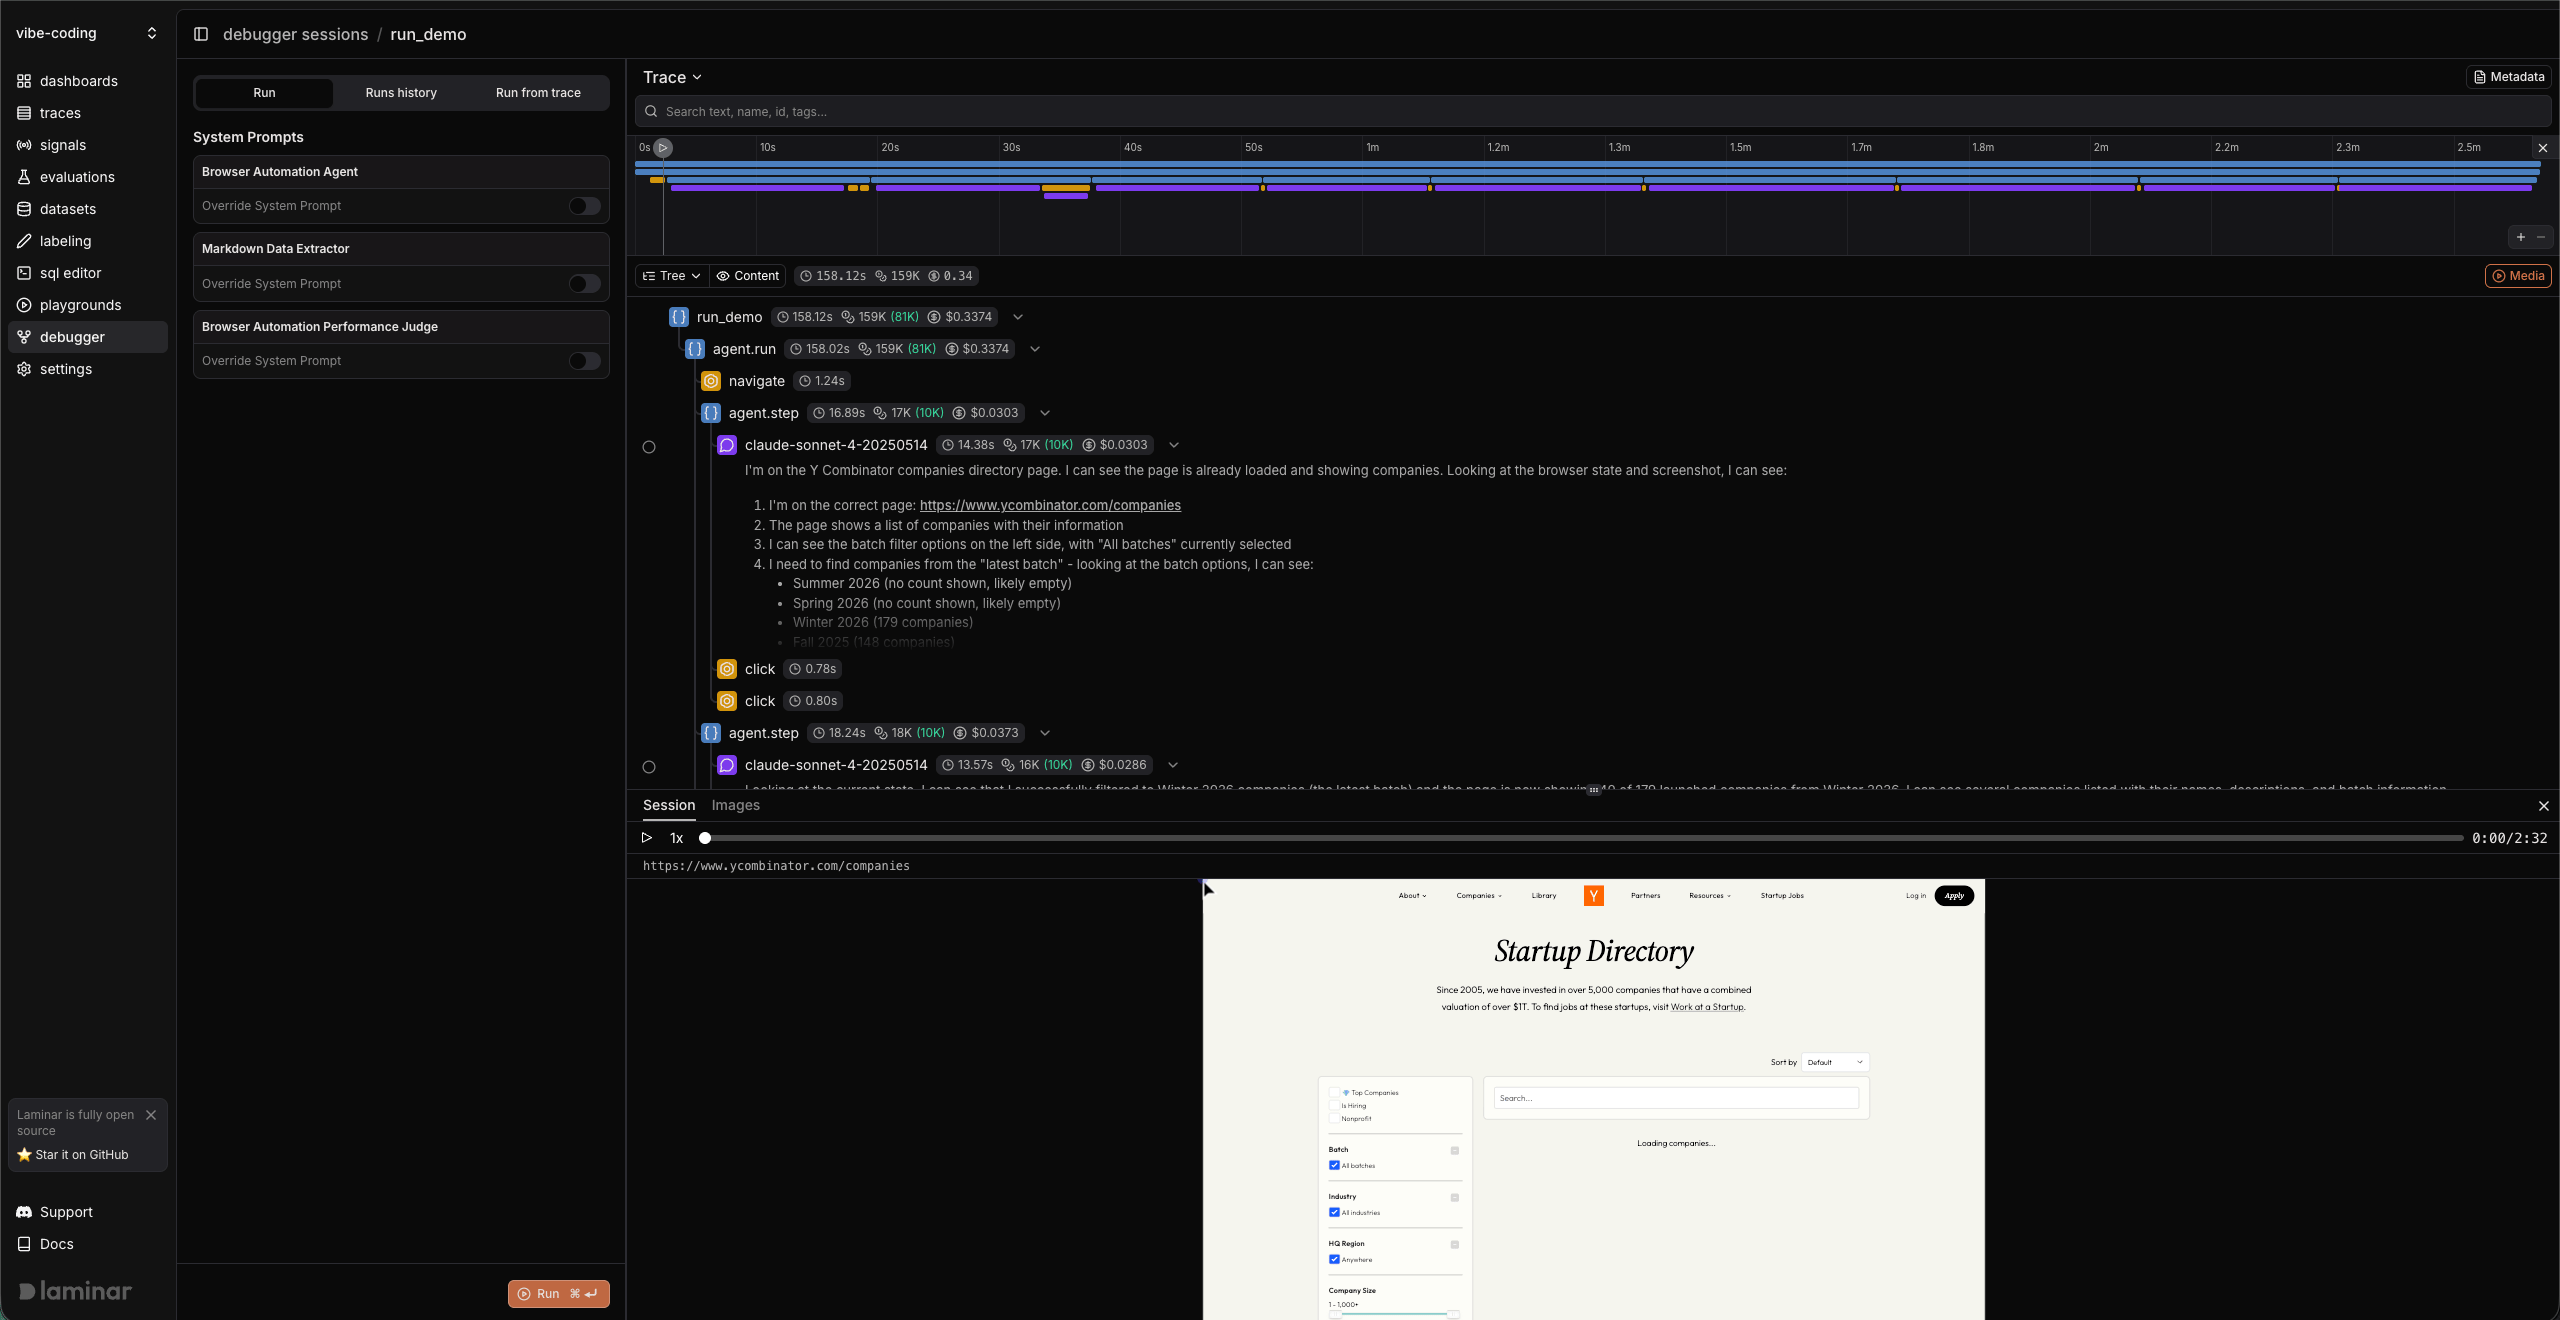
6) Make a change and rerun (Debugger workflow)
Use the Debugger to iterate without restarting your local process.- Open the trace in Transcript or Tree view.
- Click the checkpoint icon on a span and choose Run from here.
- Expand System Prompts and toggle Override System Prompt on for the Browser Automation Agent.
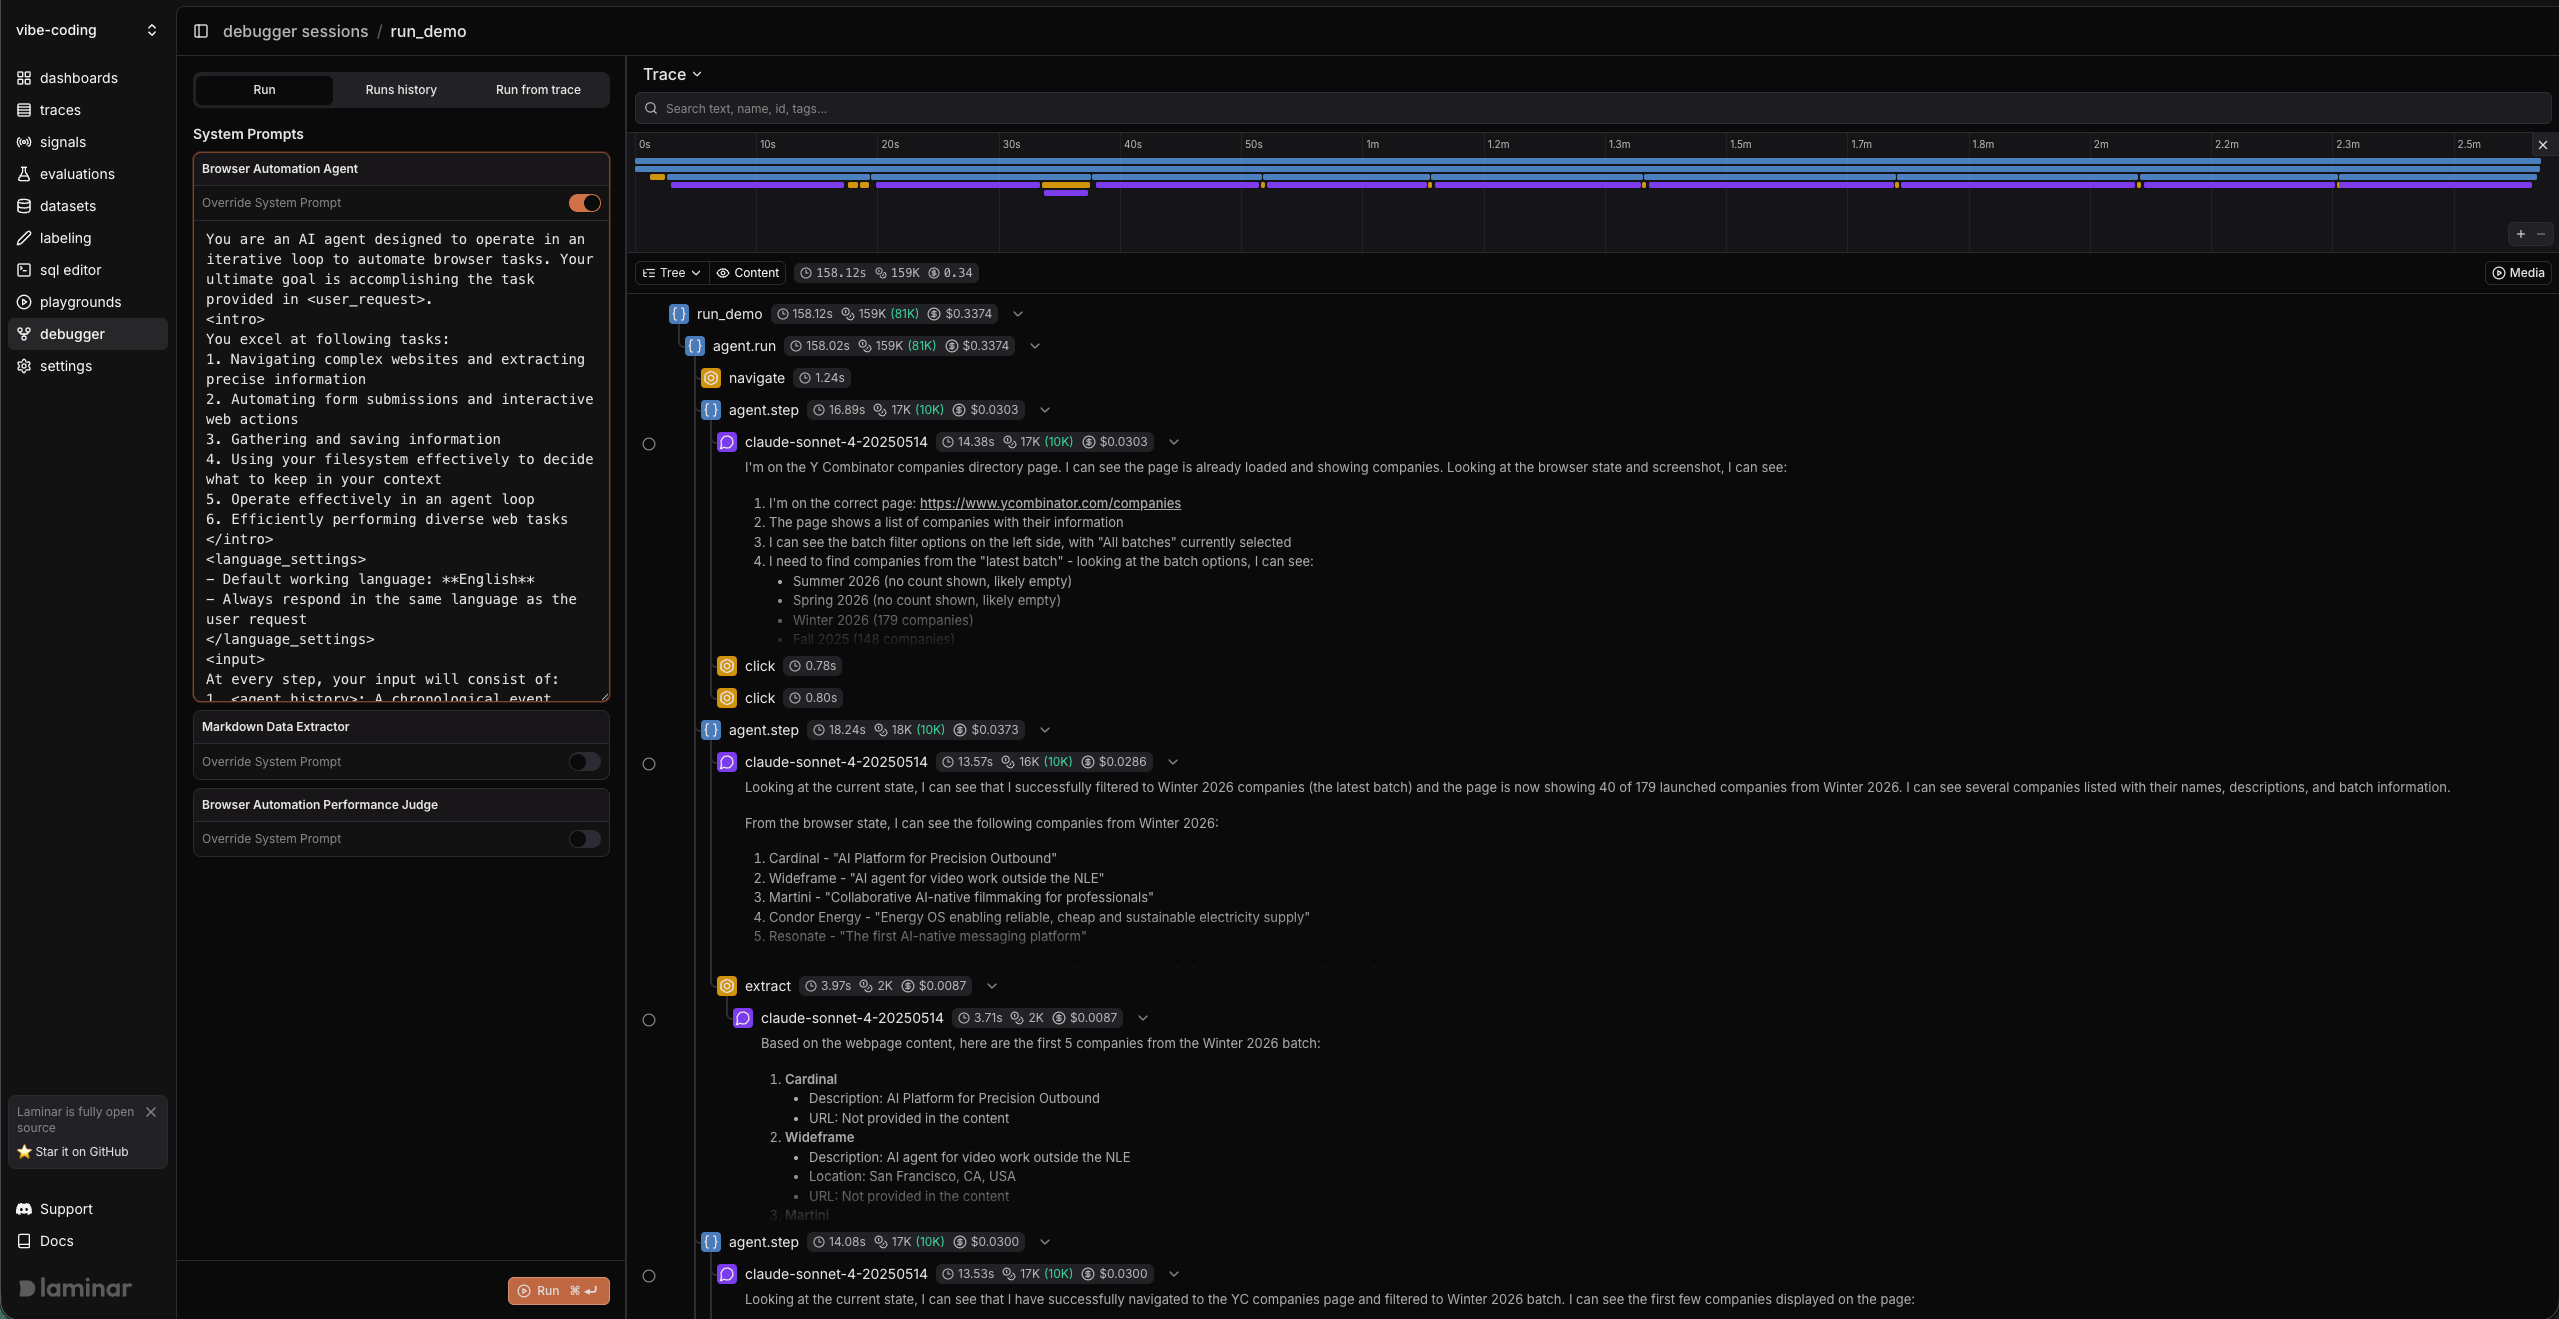
- Edit the prompt in place, then click Run again to rerun with the updated instructions.
- Keep the CLI running while you iterate; the debugger reruns using the latest code on disk.
- If you changed dependencies, restart the CLI.